
In this article, pag usapan natin ang trend trading. No one can predict the future, kaya wala rin makakapag sabi kung saan mag sisimula ang bagong trend or kung saan ito mag tatapos.
Maaaring may mga ilang traders na nakakasabay sa trend bago pa ito mag simula, pero the question is the level of consistency.
Gaano kadalas? Maybe once or twice.
Normally, nag simula na ang trend bago pa ito makita ng mga traders.
Hindi natin kailangan laging timingan ang market to make a profitable trade, ang kailangan lang natin gawin ay malaman kung may bagong trend na nagsimula.
In this article, I will discuss how to identify the start of a new trend.
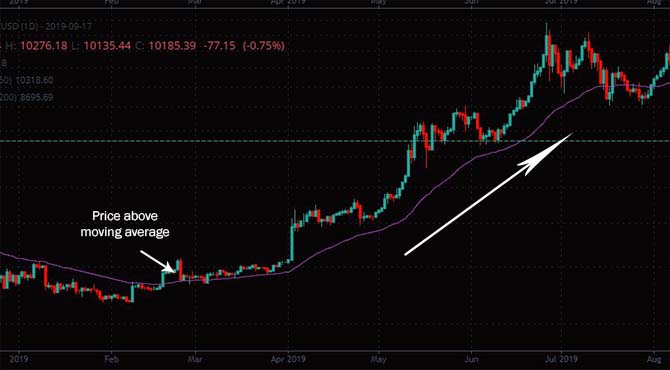
Moving average
Ito ang pinaka common at napaka obvious na ginagamit ng mga traders para makita if there is a new trend direction, whether it is uptrend or downtrend.
Simple lang naman ang gamit ng moving average.
Kapag nag cross ang moving average at price action at napunta ang price sa ibabaw ng moving average, there is a possibility of an uptrend.
Kapag naman nagkaroon ng crossover between the price and the moving average, at napunta ang price sa ilalim ng moving average, there is a possibility of a downtrend.
Ang isa pa sa pinaka common na gamit ng moving average ay ang combination ng dalawang moving average with a cross over.
So ano ang nangyayari dito?
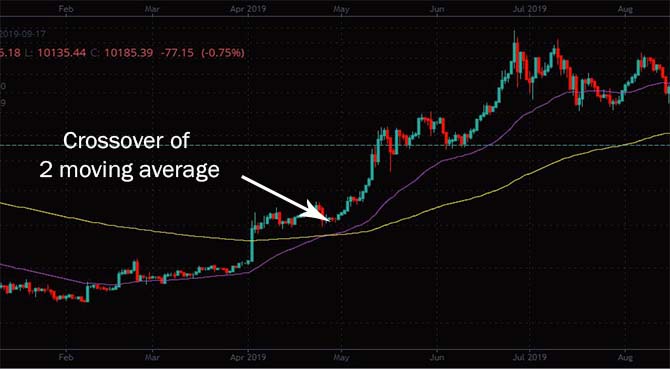
Let say for example, sa chart naglagay tayo ng 50 EMA at 200 EMA, kapag nag karoon ng cross over between the two moving average, at umibabaw ang 50EMA sa 200 EMA— it could be a sign of a trend changes from bearish to bullish.
Therefore, traders can say that this is a new trend, but not the beginning of a trend. Pero malapit lapit na dun.
Always remember, na ang moving average ay isang uri ng lagging indicator, Maaring hindi mo agad makita ang start ng new trend, nakadepende ito sa length ng moving average na gagamitin mo.
Support and resistance levels
Kadalasan nag bobounce ang price kapag tumatama ito sa isang resistance level at support level. At kapag nangyari ito, maaring pagsimulan din ng bagong trend.
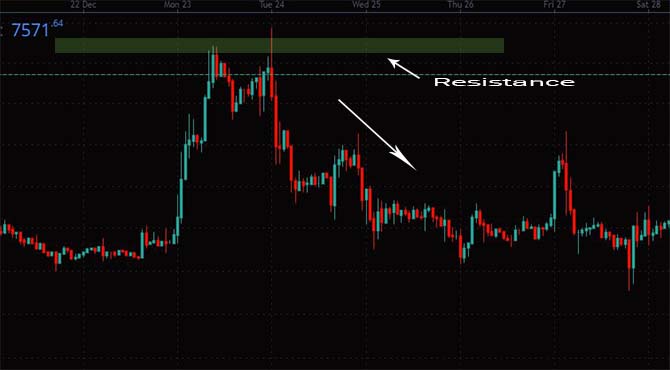
Kapag nasa uptrend ang market usually, makakakita tayo ng higher highs at higher low.
Pero once na tumama ito sa isang resistance level at ang price ay nag retrace at nag intersect sa higher low and the price close below it.
This could be a sign of a possible trend reversal and the start of a new trend.
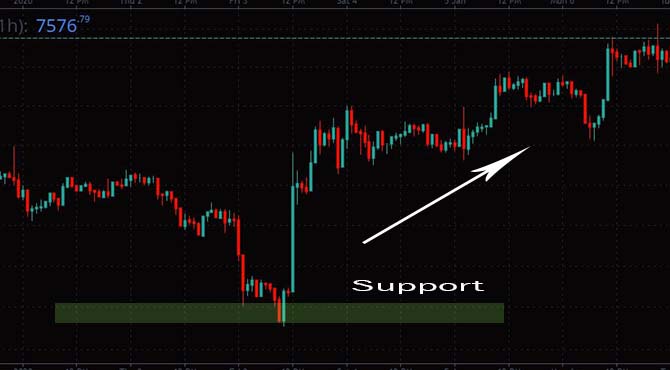
Kapag naman nasa downtrend market, nag coconsist ito ng lower highs at lower low.
At once na ang lower high ay na intersect ng price at nag ended above it.
Masasabi natin na this is a possible trend reversal and get ready for an uptrend.
Trend line breakout
Isa sa pinaka the best way para ma identify ang possible end at start ng trend ay ang pagamit ng trendline.
Dito papasok yung trendline breakout.
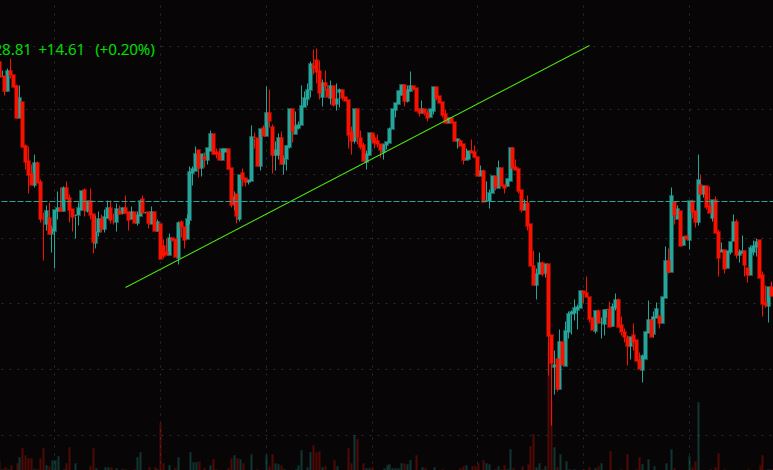
Ang mangyayari dito, guguhit tayo ng uptrend trendline kung ang market ay pataas.
At kapag na break ang trend line na ginuhit natin and the price closed under the trend line. Be ready, kasi maaring ito na ang end ng uptrend, at sa pagsisimula ng downtrend.

Same thing kapag nasa downtrend market, guguhit tayo ng pababang trendline at kapag na break ang trend line paitaas and the price close above it, this is a possible sign of a new trend.
Ang problem lang sa trendline na nararanasan ng mga traders this could be a subjective approach.
Kasi minsan para malaman ang overall trend nang market, kailangan natin gumamit ng multiple trendline. Ito yung tinatawag ng fanning trendline.
It means, mayroon tayong short term trendline, intermediate trendline at long term trendline.
Ngayon mamimili tayo kung anong ifofollow nating trendline bago pumasok sa trade. Na sa tingin ko hindi ganoon kadali.
Failure test
Magagamit lamang ito sa prolonged trend, meaning matagal ng nag uuptrend or downtrend ang market at ang hinihintay na lang natin ay ang exhaustion.
So paano ito maidentify?
Malakas ang momentum ng price paitaas
Magkakaroon ng retracement sa ( weekly chart )at mag pupush ulit paitaas ng kaunti
Heavy rejection will take place, na mayroong engulfs bear candlestick.
But then it will retrace ulit paitaas naman, bago mag tuloy tuloy paibaba.
Dito natin makikita ang exhaustion ng price at pagkawala ng power ng bulls. And this is the time that we can enter a trade, and put a short position.
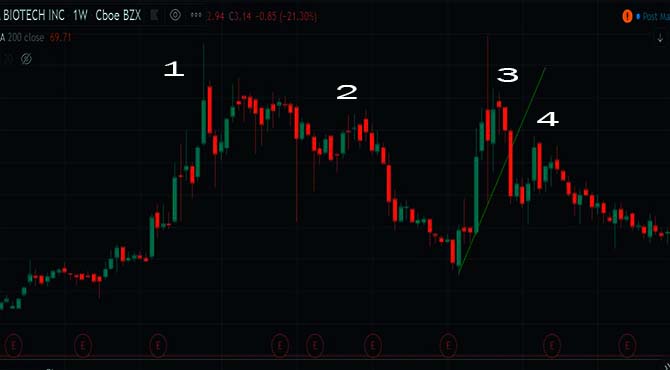
Ang example image na ginamit ko sa itaas, ay hindi galing sa chart ng any cryptocurrency.
Ito ay ang chart ng Edesa Biotech Inc from Stock market. wala akong idea, kung anong klaseng company ito.
Ginamit ko lang ito as an example sa failure test. Kasi ang ganitong situation ay nangyayari sa lahat ng market Cryptocurrency, forex, stocks, futures, etc.
Ang nakikita nating image sa itaas ay ang weekly chart ng Edesa. Kitang kita natin kung paano ito nag uptrend , at umabot ito ng $800 per share noong 2013. Ito yung all time high.
However, makailang ulit nitong tinangkang ma break or maabot ulit ang all time high pero hindi na ito nangyari. Dahil sa lakas ng rejection.
Masasabi ko na this is one of a good example of failure test, dahil na rin sa exhaustion sa panig ng bulls. At hindi na ito naka recover hangang ngayon. Naglalaro na lang ang price nito sa $3 per share.
Marami pang ibang ways para ma identify if there is a new trend.
Nandiyan ang mga indicators tulad ng MACD, RSI, Stochastic etc.
But most of these indicators ay subjective, kaya we need more confirmation from price action, para mas mapag tibay ang ating assumption.
And we can make sure that we have an edge. Bago tayo mag desisyon to enter a trade.
Remember always trade what you see not what you think.

Pingback: Trading Range Breakouts(Explained Tagalog) - Altcoinpinoy